 Not that long ago we talked to you about the
BIOS -
BIOS is an acronym that stands for Basic Input/Output System. It is meant to control your product at a very low level. As of right now there are three regularly used BIOS formats (there are actually more than that but there are three common ones). These are the AMI (American Megatrends Incorporated), Award, and Phoenix. The X79-UD5 is not our first time with Gigabyte’s 3D BIOS and every time we use it we fund new things to like and dislike about it. ON the plus side it is a fully functional BIOS. Once you get past the 3D interface you will find the same layout and functionality that you would find in any Gigabyte BIOS. On the down side, for the second time in a row after upgrading the BIOS our Logitech G5 mouse stopped working properly in the UEFI interface and we had to swap it out for a different one to get things going again.
You can check out the 3D BIOS in the video we shot of it during our testing.
Overclocking -
Our work on overclocking the X79-UD5 was interesting. We ran into a couple of issues that did not seem to make any sense. After having success at 4.5GHz (45 x 100) the system shutdown during a test and then refused to post of the multiplier was more than 33. We were able to bump up the BLCK to 125MHz and run the multiplier up to 36 for another 4.5GHz OC though. This overclock managed to run through all of our tests without a problem. 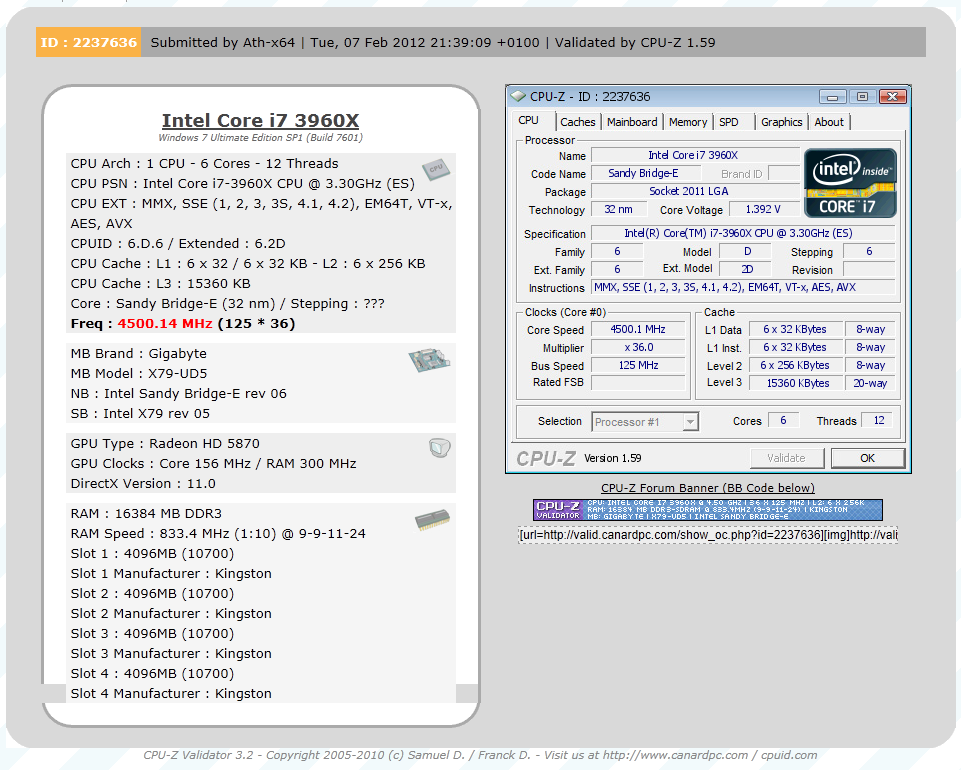
Of course overclocking is a picky subject. I can buy to identical CPUs from the store and they will not always perform the same way under stress. This is the same with motherboards, RAM and GPUs. So again it is important to keep in mind that our results represent a specific hardware configuration. Yours may be similar but will rarely be identical.
Overclocking Tools -
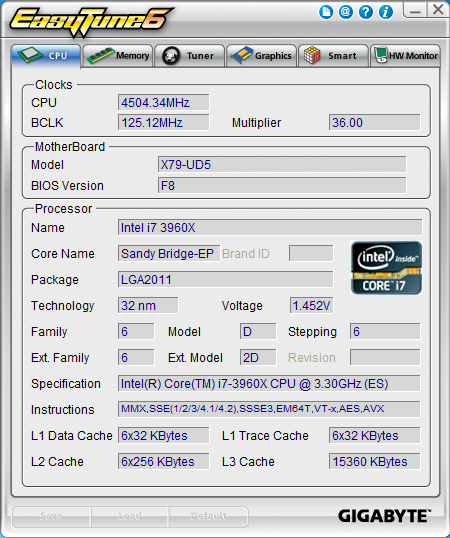
As you might have guessed the X79-UD5 also comes with Gigabyte’s EasyTeun6. We have covered this tool on more than one occasion so we will not go into too much detail, but we will say that the utility is functional if somewhat cluttered and non-intuitive. The first two pages are pretty much the same information you would see from a CPUz readout for your processor and memory.
 |
 |
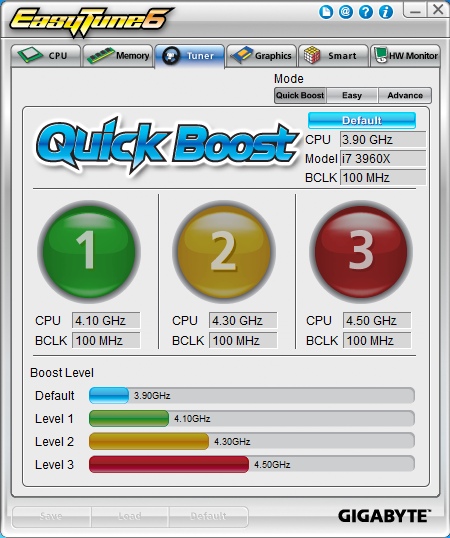
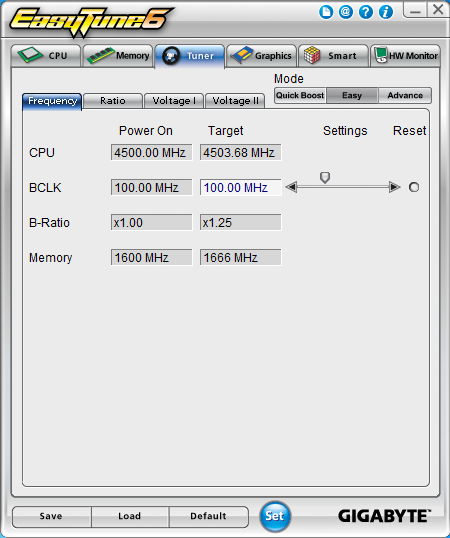
The third deals with overclocking. You have three levels of control here;
QuickBoost which gives you three click-and-go options for overclocking
Easy which only lets you adjust the BCLK
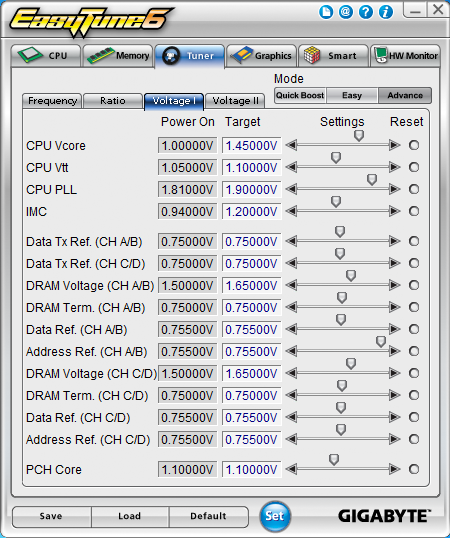
Advanced which gives you a very large number of options for overclocking from inside Windows.
 |
 |
 |
Tab number fours lets you overclock some GPUs, but only up to the limits of their default voltage. There are no options for voltage tweaking, even if the card supports it.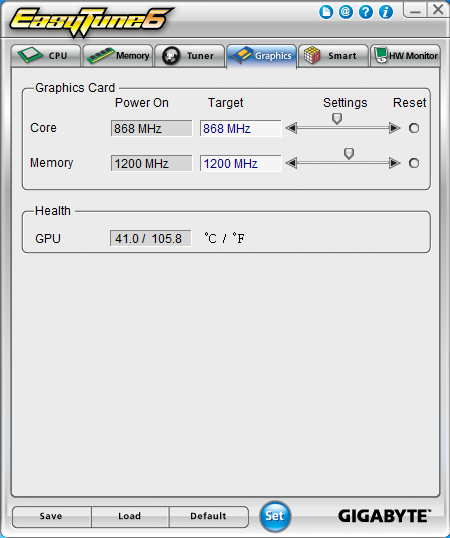
The last two pages deal with monitoring and cooling. Page five has options to adjust the SmartFan profiles while page six is your hardware monitor.
 |
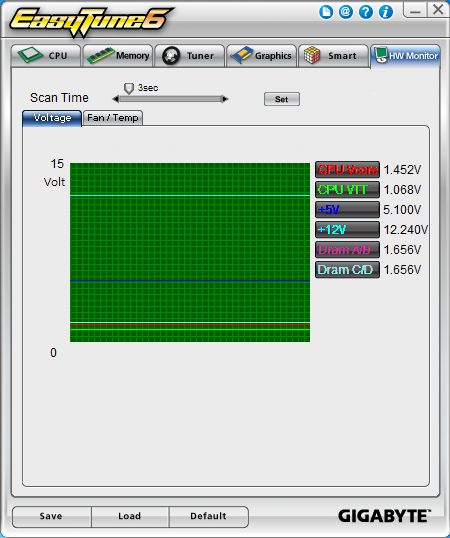 |
Like we said, functional but not the cleanest utility out there.
The Test System and Comments -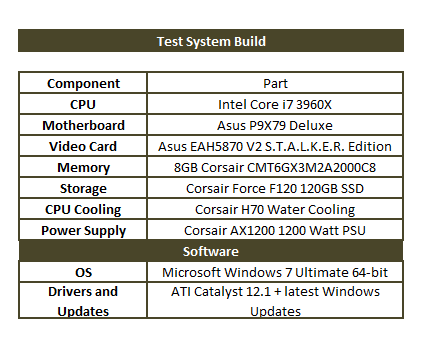 Our test system is built on an open bench. This has two effects on testing. First it allows us to see everything and also to setup and disassemble the test rigs quickly. Second it means that we cannot gauge the potential air flow found in a normal case. The air is pretty stagnant; some may say this is a great neutral testing method and it can be. However, it does mean that the temperature reading taken off of the components are not accurate to what an average consumer would see. This means that your thermal performance will vary from what we see here.
The setup on the UD5 was quick and easy. We did not have to remove many items from the installer list (and there was no Chrome or Google Toolbar to remove), we do wish that Gigabyte would include the WiFi driver and application setup in their normal DVD, but we imagine that will have soon enough.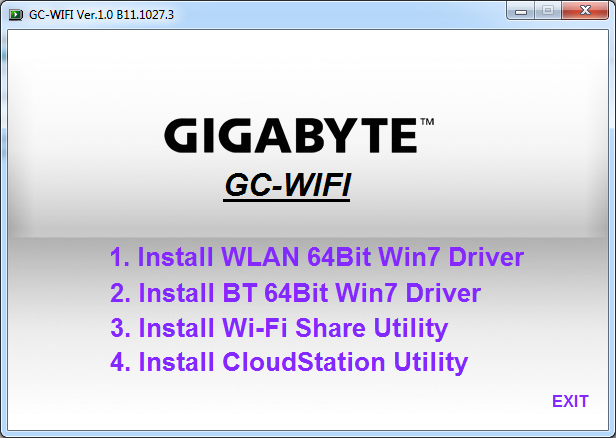
Speaking of wireless, the card included does have some nice performance. You will need to sacrifice an x1 slot and a USB header to use this though. We also found that some of the software was not all that intuitive to use. When you install the WiFi and Bluetooth drivers you have the option to install two additional pieces of software. These are the WiFi Share utility and the CloudStation utility. The WiFi share is simple and does what it says, it allows you to share your internet connection using the WiFi card. The software is a virtual router and while not as fast as a hardware router is still pretty nice.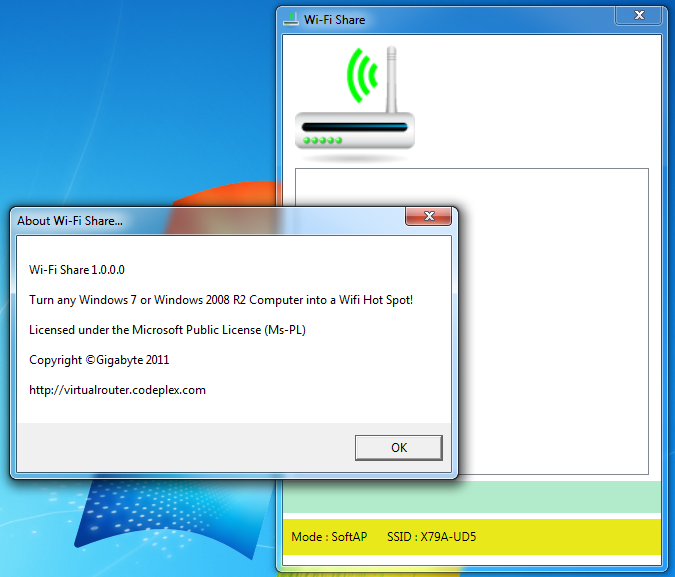
On the other hand the Cloudstation software that allows you to use your PC like a cloud server was not our favorite. To use it you have to turn off EasyTune 6 and Cloud OC. Now you might argue that if you are going to use this like a server you would not want it overclocked anyway, but that might not always be the case. Additional software is also required to take full advantage of the CloudStation software.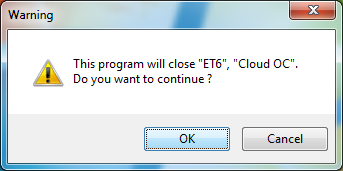
For many people both of these software add-ons are not going to be of use or interest, but it is nice that Gigabyte included them if you want to sue them.
Performance testing overview -
Our testing is a little different than most. We combine both synthetic and real-world applications to simulate the types of performance common to the individual products. For motherboards this means that we run roughly six synthetic tests and two real-world. We will be expanding the real-world testing in the near future. But there is more to performance than just the raw numbers. As there are multiple components and sub-components on a motherboard there each item can have a distinct impact on the way the product will perform once you get it in your system. It is important to note not only the actual results but what they mean to you as a potential consumer. We will try to give this information to you.
But we do not just cover the performance aspects that are measurable. We also talk about the components that might not have a direct benchmark. These are items like Audio Quality, ease of use and installation.
Section 1 Subsystems
Memory -
Memory performance is very important on a motherboard, especially when you have a CPU with multiple cores and threads. If you have slow memory your cores and threads can become starved for data to execute. To test memory performance we run both Sisoft’s SANDRA and AIDA64. These two combine to not only give us accurate numbers but to validate each other. For testing at stock speeds the memory is hard set to 1333MHz while overclocking testing is done at the highest stable speed for the voltage of 1.65v this is due to the different memory dividers for each CPU. As such, the memory speeds will vary greatly. This means that the overclocked numbers are a little misleading and while they can show a trend are really only included to show if a board has a problem with memory performance at high clockspeeds.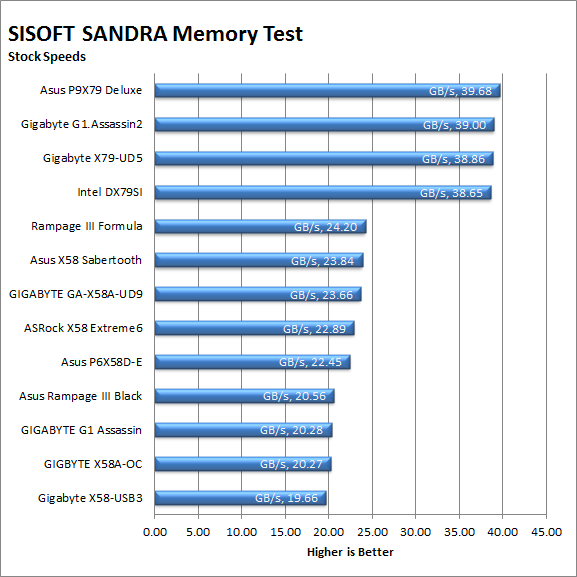
The Gigabyte X79-UD5 is in the top three of our test group for memory performance. It trails its bigger brother by only .14 GB/s. This is a good showing and could indicate a solid performance in most of our testing suite. The overclocked scores give us a better showing as the memory speed was increased from the base 1600MHz up to 1666MHz. 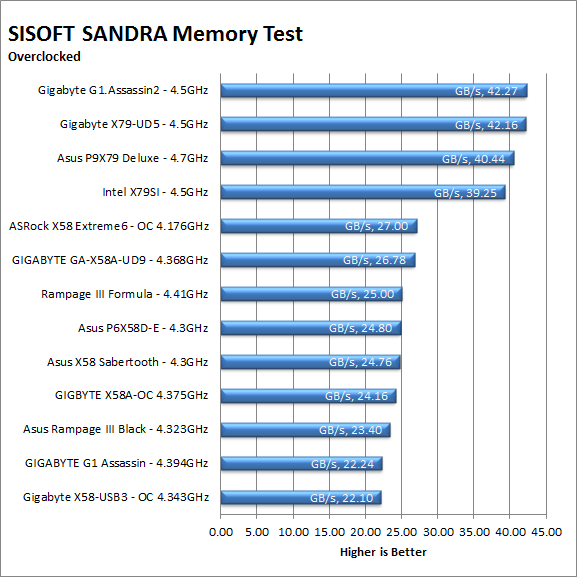
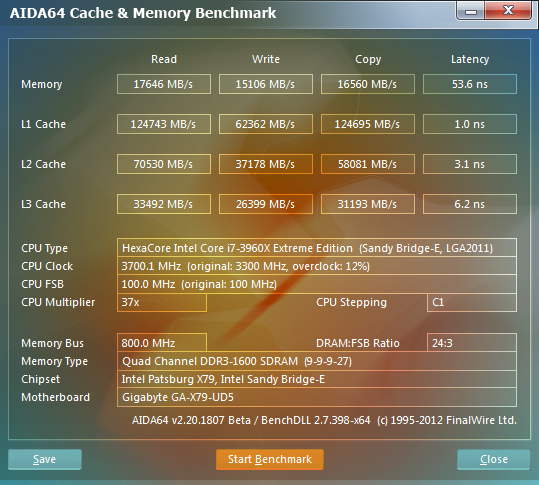
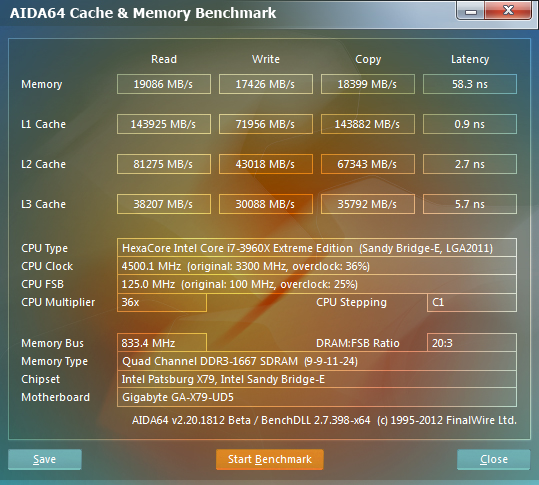
As always, our AIDA64 scores show the detail behind the aggregate scores that SANDRA offers.
| AIDA64 Stock Memory Performance | AIDA64 Overclocked Memory Performance |
 |
 |
Drive performance -
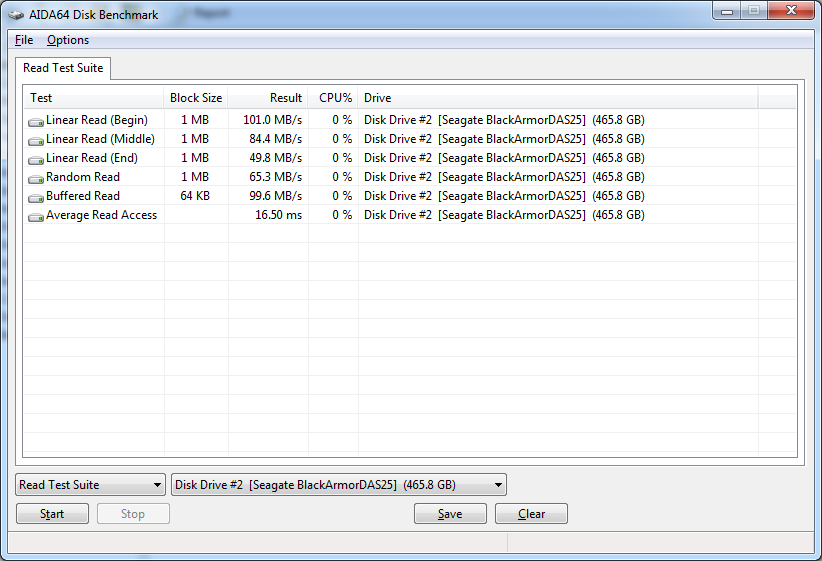
Drive performance is also one of the major subsystems that goes to make up the performance of a motherboard. For our testing we use Sandra and AIDA64 again. We only test with single drives for each type of controller present on the motherboard (unless it is a professional product where we will use RIAD 5 and/or 10). We have also begun using a Seagate PS-110 USB 3 external HDD for our USB 3.0 performance. As a side note, we include the overclocked numbers here to make sure (again) that you are not going to see a major drop in performance due to minor instabilities at high clock speeds.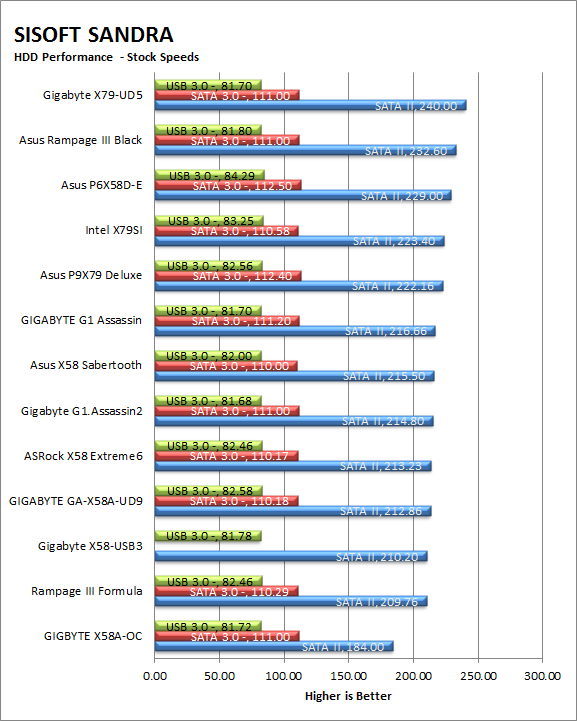
The HDD performance on the X79-UD5 is very nice. At stock speeds it manages to unseat the Asus Rampage III Black which has been at the top of our list for a long time. Unfortunately overclocking the system brought the HDD performance back down and the X79-UD5 came in third. 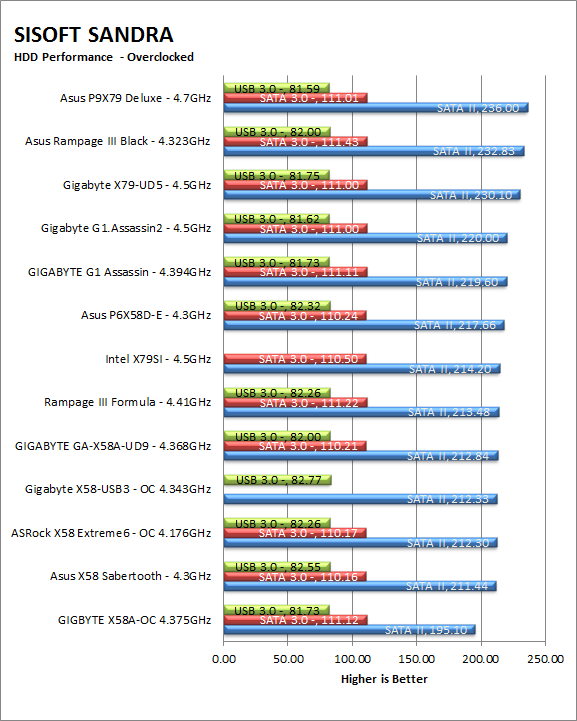
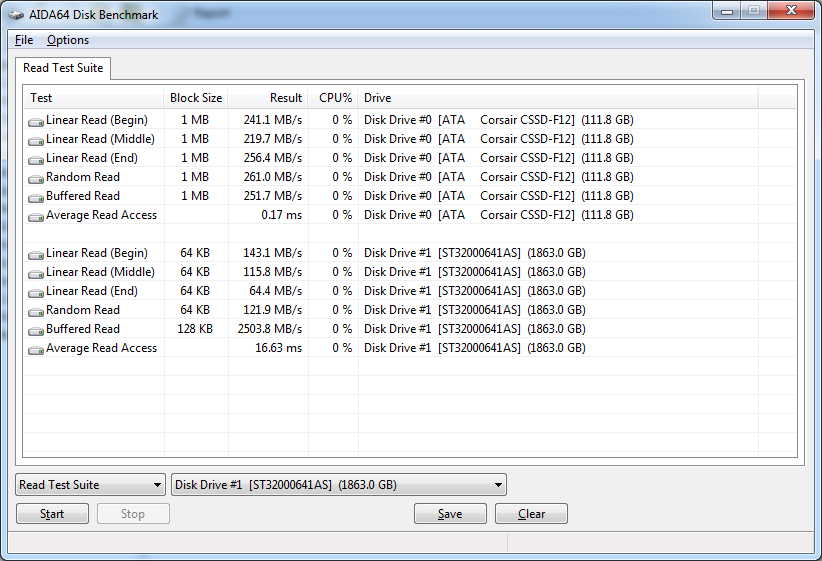
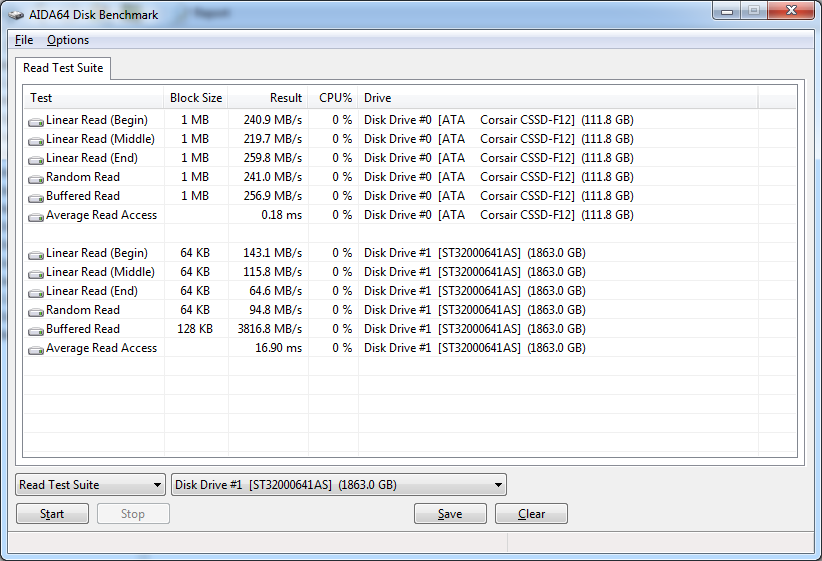
AIDA64 gives us some additional read performance numbers. Here we can see a little bit more information on the types of read functions that are going to impact your performance on the UD5.
| AIDA64 Stock HDD Performance | AIDA64 Overclocked HDD Performance |
 |
 |
| AIDA64 Stock USB 3.0 Performance | AIDA64 Overclocked USB 3.0 Performance |
 |
 |
Power -
Power efficiency is another of those misnomers that we get caught up in. We hear about idle states and power gates. But what does that mean to you and I? On the surface having power management that reduces idle power sounds great and can be a benefit to someone that leaves their system on for long periods of time (and inactive) but how a system handles power under load and the delta between the two states is often more important than the idle power usage numbers. We use only P3 Kill A Watt instruments for measuring power. 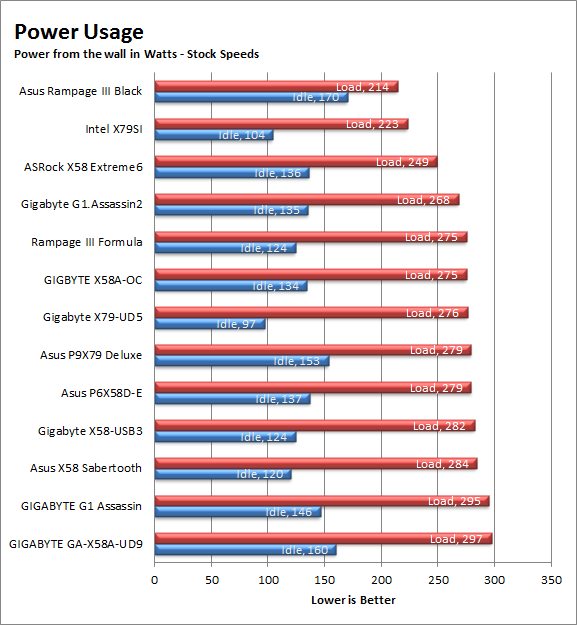
The X79-UD5 is about average when it comes to power draw. It does have one of the lowest idle power draws of the X79 boards we have tested, but once you push the board it ramps up very quickly. Our average power draw from the wall under load was 276 Watts which can add up quickly if you are trying to save money on your power bill.
Cooling (Board Level) -
Board level cooling is an important factor in product performance and longevity. Components like the chipset, VRM modules and even capacitors need to be kept relatively cool to prevent failure. As these parts are made of silicon, they have a thermal breakdown threshold; or melting point. At that temperature the actual transistors built into chip will begin to deform and break down. Granted, the threshold is often very high, but you still need to make sure that components stay away from this level of heat for longer product life. 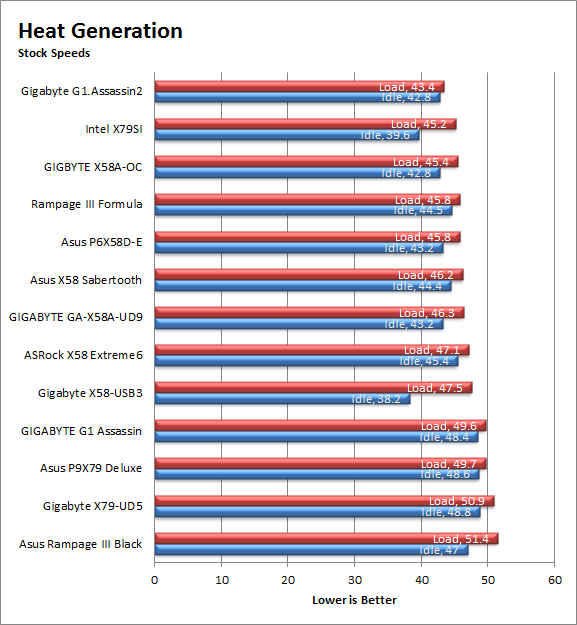
The cooling on power regulation for Gigabyte’s X79-UD5 did not do so well with our Epic180 on the board. There was not enough air flow across our open test bench to keep the VRMs cool (although they were not in danger of overheating). This is something important to think about if you are planning a build using this board. Make sure the case you have chosen has good air flow or use an air cooler that can keep the air from stagnating around the top heatsink otherwise you could end up with a problem.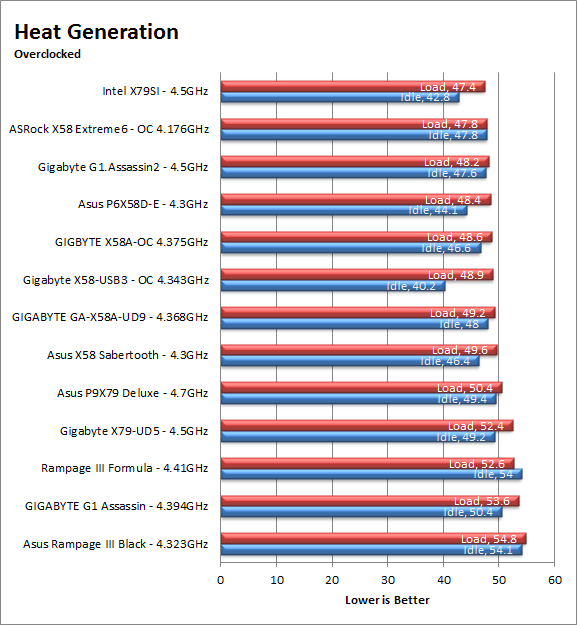
Audio -
Audio is highly subjective. What we find pleasing may sound “off” to you. That is always going to the problem with testing audio; results will vary too widely depending on the tastes of the listener. However, there are ways of measuring the audio output with an objective ear. There is also the issue of audio causing performance issues in gaming and video playback. The reason this is a potential source of concern is that all onboard audio CODECs (Compression/Decompression) are CPU controlled. This means that while the audio chip controls the audio levels and effects of the audio the actual work is done on the CPU. Usually this will not be a problem with today’s powerful CPUs. Even the lower and consumer level products can handle high-end audio these days. But again there is the chance that a bad design or software will hinder your system and performance. On the other side the limits of board space, cost, etc will also prevent the level of audio quality you can get from an add-in board. We test all audio parts with three media types, Movie (DVD), MP3 Music, and Gaming. These are pushed to our Tec On model 55 Tube Amp to see if we can detect any signal issues in the reproduction.
The audio on the X79-UD5 is a little better than most of your onboard audio. It has a clean sound thanks in part to Gigabyte’s use of Dolby Home Theater v4 software to control the audio output. Although the audio CODEC used is still a Realtek ALC898 the additional software helps to add in a level of signal processing that compensates for the brassy sound that you can get with this chip.
Networking -
This one is something that is a requirement anymore. If you have a computer, the chances are good (like 99%) that you are also connected to high-speed internet. With this you need a good and solid LAN chip to make sure that your data flows properly out and back.
The network controller on the X79-UD5 is nothing special. It will do the job and keep you connected at 1Gbps speeds, but it is not what you would call a high-performance LAN controller. It is designed with cost in mind.
Section II - Performance Tests,
Synthetic -
In this section of testing we cover the synthetics. These are tests that run a scripted sequence of internal APIs or that use another installed application to perform a series of scripted events. They are great in that they can provide reproducible results across various platforms. On the down side, synthetic tests can be fooled with driver tweaks and optimizations. In some cases it is necessary to rename the .exe file to something generic to discover if this is the case. In any event when this is needed (when a test shows a drastic difference in performance over the renamed exe) we will note this and show both results for comparison.
PCMark7 -
PCMark7 is the latest general performance test from FutureMark. As each generation of this benchmark has evolved and developed we have watched them add more and more realistic tests to this suite. With this generation we find more media tests, (audio and video transcoding) moving of large files, multiple web page rendering, and much more (the even added DX10 gaming). We use the Overall Performance and Common Usage suites in our testing.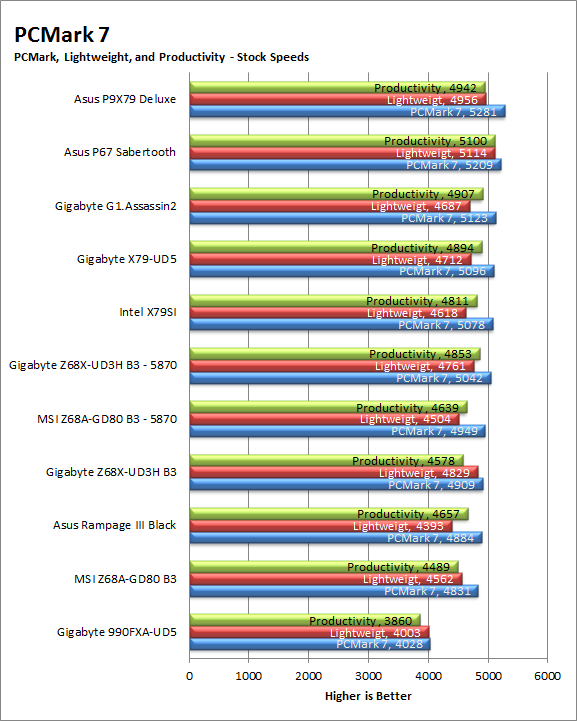
The X79-UD5 does fairly well in our PCMark 7 testing, it falls in line right at fourth place. This is not too bad as the delta between the systems in the top five is not that large. There is only a 27 point difference between the UD5 and the G1.Assassin2 which in real world terms would not even be noticeable. 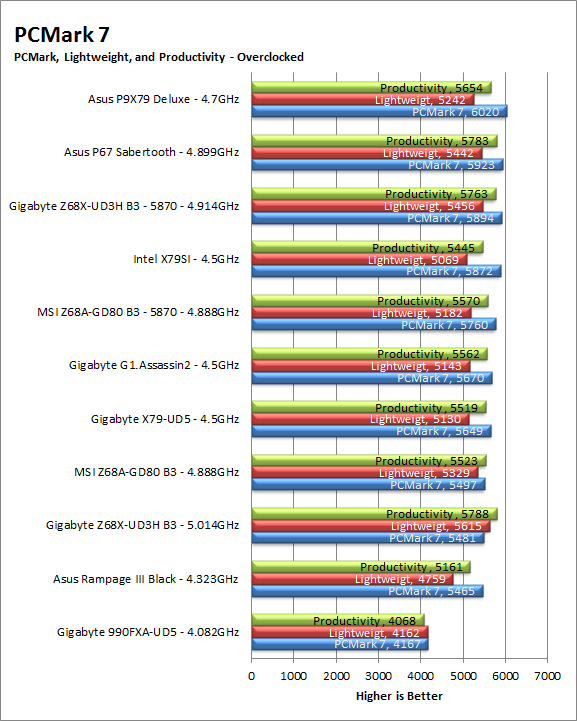
3DMark 11 -
3DMark 11 is the other Futuremark test that we run on our motherboards. This test simulates the typical tasks that a GPU (and system) would have to perform to provide you with a good gaming experience. It is based on the DX9, DX10 and DX11 engines but can only be installed on Windows Vista or later. The suite of tests covers DX9, DX10, and of course DX11 rendering; it also covers AI computations and physics. That’s right I said Physics the latest version of 3DMark uses a Havok physics engine. This removes the advantage that nVidia had with 3DMark Vantage. 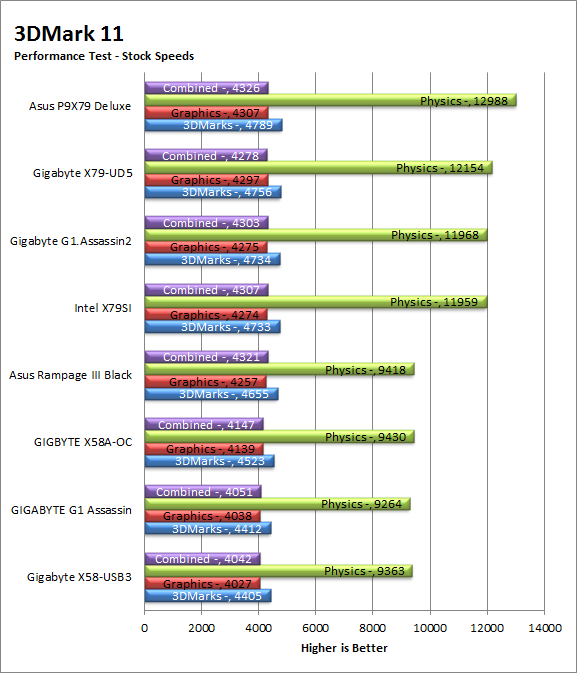
For 3DMark 11, our synthetic gaming test) the UD5 falls into place just behind the Asus P9X79 Deluxe. The Asus X79 board does manage to pull off a much higher CPU based Physics Score, but the overall points are not that far off. Unless there is a huge issue with audio processing we should see good gaming scores later on.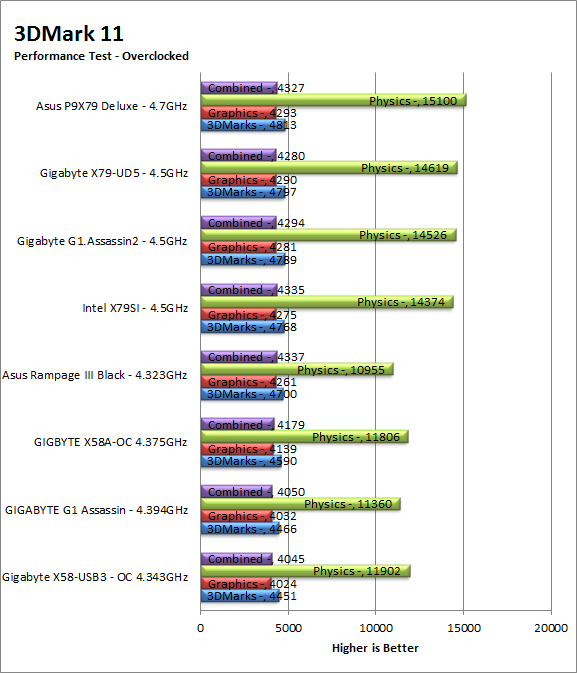
HyperPi 0.99b -
HyperPi is a front end application that allows you to easily run multiple instances of the SuperPi application. SuperPi, for those that are not familiar with it, is an application that measures the time it takes to calculate the number Pi out to as many as 32 million places. This calculation is then checked and run multiple times (up to 24 for a 32M run). This test stresses the CPU, Memory and HDD as data is handed off between the three. If there is a weak link, HyperPi will show it. For our testing we run the 32M test on as many cores (and threads) as the CPU has available. The slowest CPU time is then recorded. 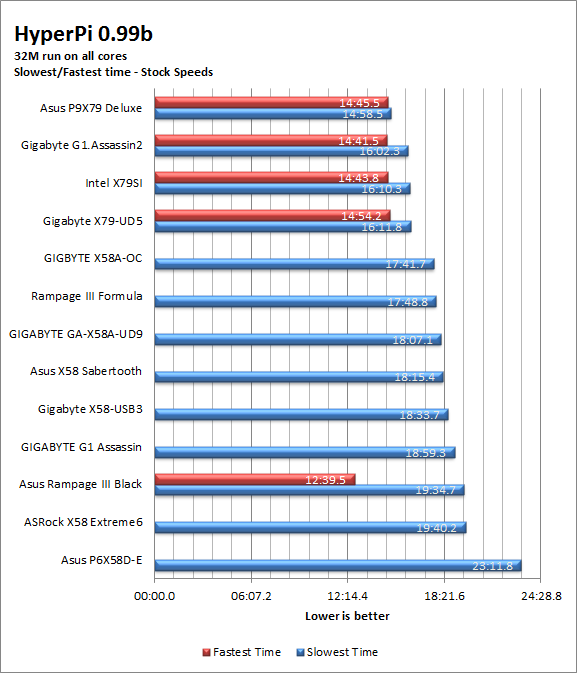
Despite having solid memory performance and excellent HDD speeds the UD5 did not do so well in our HyperPi test. It managed a slow time of 16:11.8 which is only a little behind the X79SI, but quite a bit behind the Assassin2 and the P9X79 Deluxe. This type of performance in our first CPU to memory to HDD test could indicate poor performance in transcoding and in rendering. While rendering video or 3D animation might not sound like a common task this is something that is done quite often when moving movies from a Camcorder or Camera to your PC and then processed into a usable format. 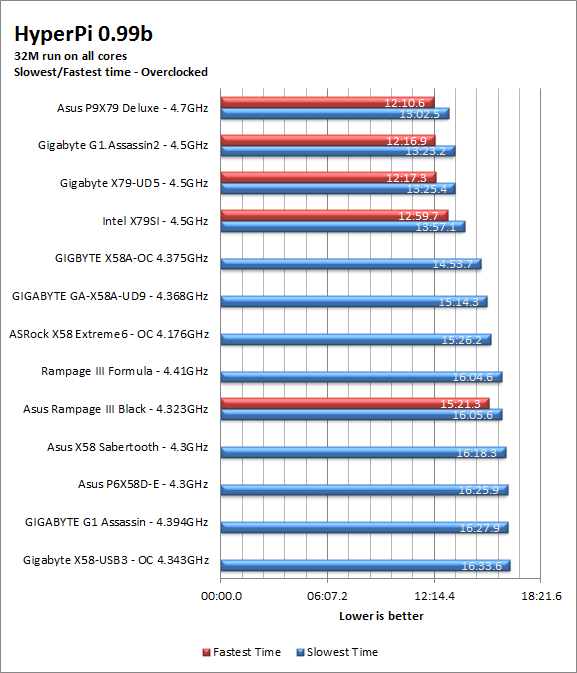
Cinebench R11.5 -
Cinebench R11.5 is the 11th release of Maxon’s rendering test. This test is based off of the Cinema 4D engine, which is one of the industry standard tools for digital animation. It is a powerful product with many different modules that can be “plugged” into it to increase its effectiveness. With Cinebench you get to see how your computer would do using this application. There are two tests; one tests the CPU’s ability to render an image across multiple cores or threads. The other tests your systems ability to handle OpenGL based rendering. 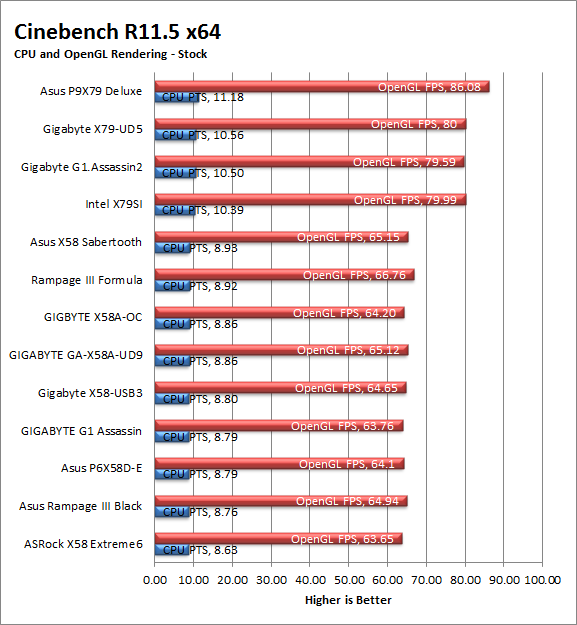
Although the X79-UD5 did not do so well in our HyperPi testing in the synthetic Cinebench R11.5 we see an improvement. Here the UD5 came in behind the Asus P9X79 Deluxe. The delta between the two was only .62 CPU points. Our 4.5GHz Overclock finds the UD5 coming in behind other X79 boards by 1-2 points even with the same overclock.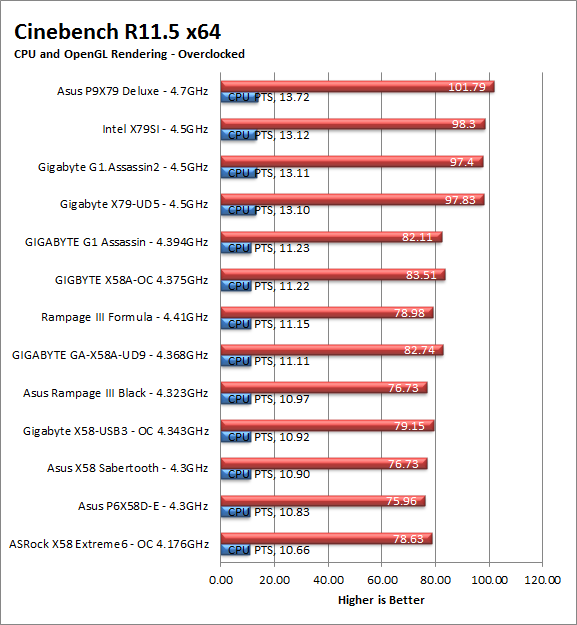
Section III - Performance Tests,
Real-World -
Here we have two tests that are designed to put the performance of the motherboard and its subsystems to the test. Both require good CPU, Memory, HDD and even to a lesser extent audio and network performance. The two tests we chose were Lightwave 3D 9.6 and AutoGK 2.55. We will be adding at least one more real-world test to this battery in the near future, but for now these two cover quite a bit.
Lightwave 3D 9.6 x64 -
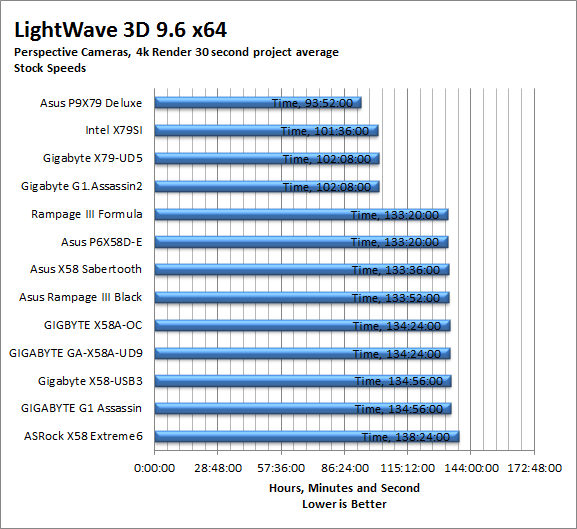
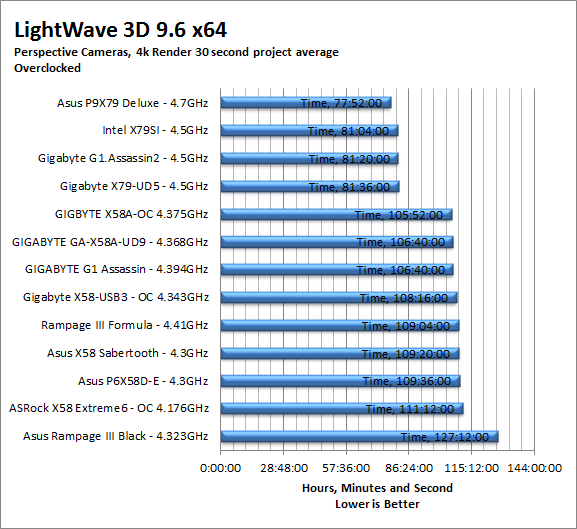
Lightwave is another industry standard application for 3D animation and rendering. It has a large tool base and the rendering engine is highly threaded (when using the right render model). This application is also capable of expanding to 4k resolutions as well as ray tracing for rending the light sources. For our testing we use frame 470 of the Pinball scene found in the LW 9 Content folder. This uses the newer perspective camera that is better suited to a multi-CPU/Core environment. This camera style also uses ray tracing and a much improved anti-aliasing method. Settings are shown below in the attached screen shot. Of course these are single frame renders and they are not a complete picture; for that you have to take into account the number of frames an average project would have. In a typical 30 second commercial you will have around 840 to 960 frames (at 28 – 32 FPS) this means that you have to multiply the time of a single frame by that number just to get a vague idea of how long that 30 seconds would take. This is because each frame will have a different render time based on complexity.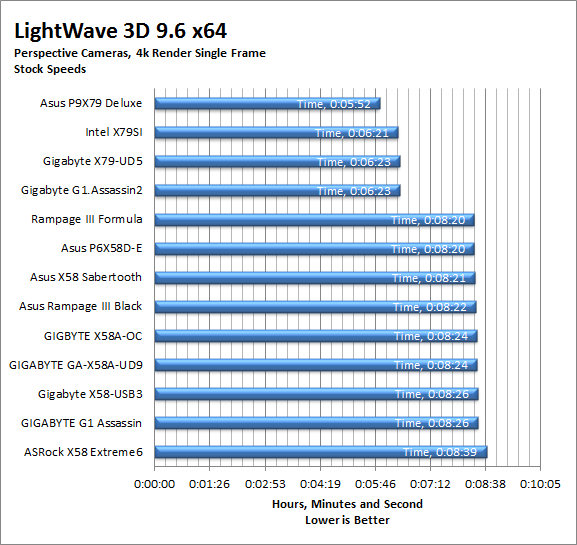
The X79-UD5 has the exact same Lightwave render time as the G1.Assassin2 which puts them in almost the same performance envelope for rendering and processing video. This is good news for Gigabyte fans that want a solid performing board (for workstation applications), but do not want to spend the extra for things like the built-in sound card on the G1.Assassin2. Unfortunately the time here is still not enough to put it on top. The UD5 is 2 seconds behind the X79SI and 31 seconds behind the Asus P9X79 Deluxe.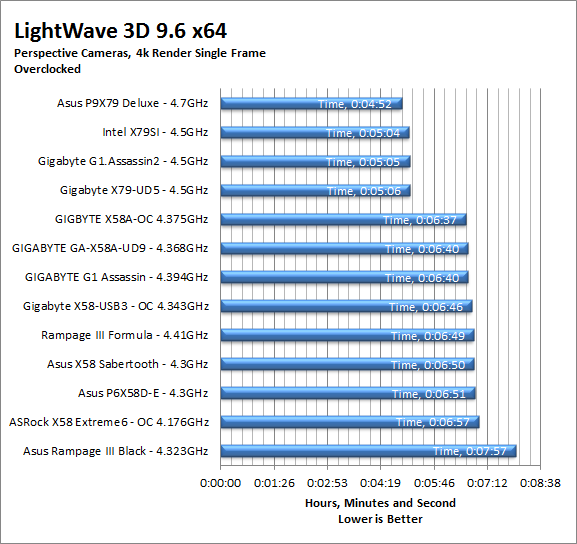
CyberLink Media Espresso 6.5 -
After having various issues with AutoGK and Intel CPUs with more than four cores we have changed our Media Encoding test to use Media Espresso from CyberLink. Although this new utility does not have the same ability to transfer directly from DVD it is still a good test to transfer different media types into a usable format for your iPad, iPod, or other media player. Our test involves using multiple (Six) 20 minute media files and transcoding them for an iPad. This gives us a very good indication of how well a motherboard can handle this type of work load.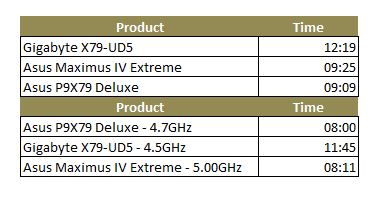
As we mentioned earlier there is something going on with the transfer of data from the CPU to Memory and then to the HDD. Although each performs well in its own right when you combine them into a single unit we are seeing obvious performance issues. We are not too worries about this though as usually a BIOS fix can correct memory timing errors that can cause these types of performance issues.
Section IV - Performance,
Gaming -
Gaming as a test of motherboard performance is sort of a joke these days. The big player in the gaming arena is the GPU. Everyone but a few hardcore PR teams know this. However, it is important to run at least a few (one from each current DX version) to see if there are any issues with the combination of components on a motherboard. These are items like Audio lag, memory lag and of course problems with the PCIe lanes and signal traces. If there are issues in design, drivers or BIOS then you can have odd gaming performance. So without much more preamble let’s dive into the three games we currently use; Call of Duty Modern Warfare 2 for DX9 FarCry 2 for DX10 and Battlefield Bad Company 2 for DX11.
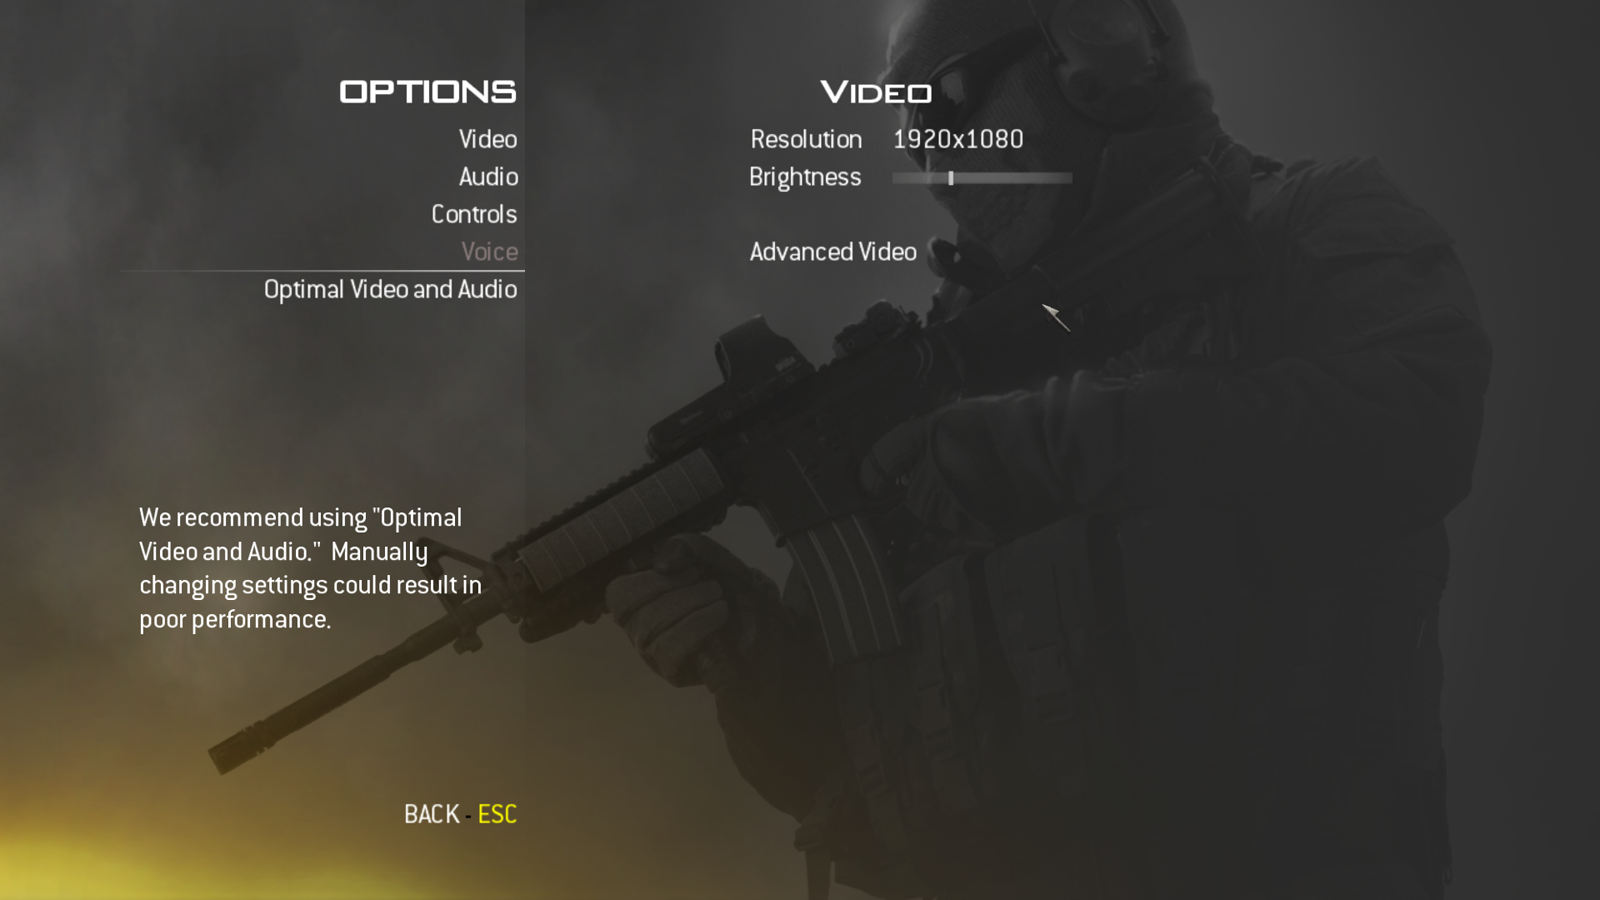
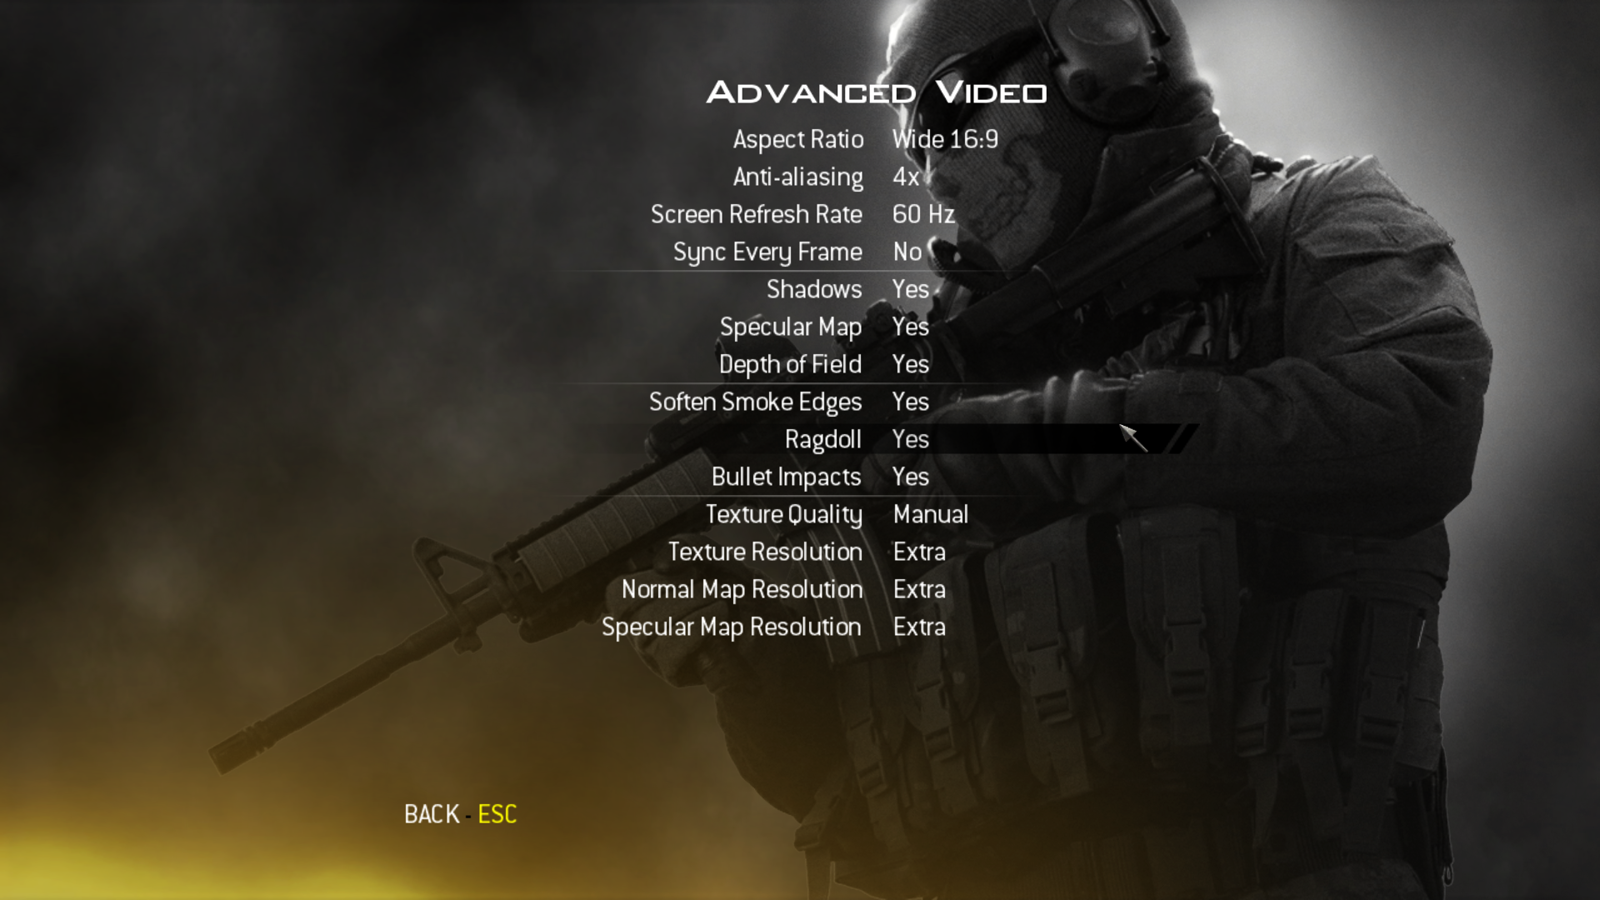
Call of Duty Modern Warfare 2 DX9 -
This is an excellent but short game that put you right into the action from the beginning and does not let up the pressure until the very end. The graphics are a little better; most notably the night and thermal imaging have been improved. The AI is still the typical COD “bar fight” style AI, with maybe a tad more finesse. All in all it is not a bad game to play and a decent one to use for testing. Our testing run starts at the bridge and ends after you clear the school in the first level of the game. Settings are shown below as are the performance numbers.
 |
 |

In our Modern Warfare 2 test the X79-UD5 comes in fourth place in the listings. However, the difference between fourth, 3rd and second is only 1FPS while even the top sport is only separated by 5 FPS. With a minimum frame rate of over 90 these differences will not even be noticeable. This will be true even if you are using a 120Hz monitor AND 3D.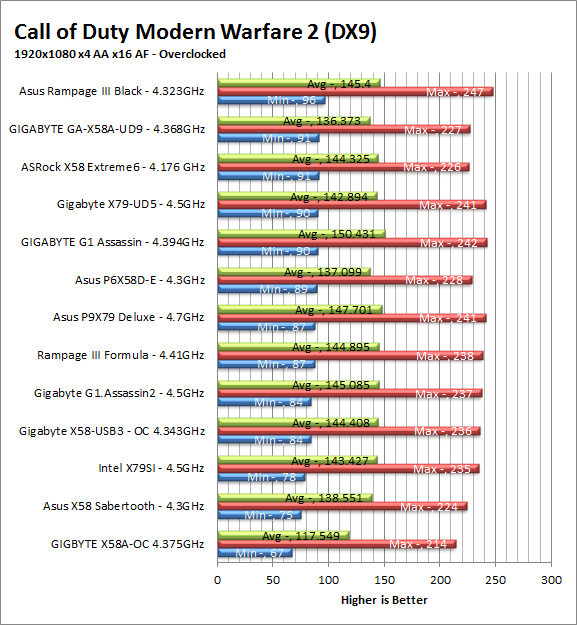
FarCry2 DX10 -
Although not one of my favorite games this tedious game does have some good graphics. The large sandbox style of the game lends to mission based play. The only problem is that the AI is rather low grade. Still the more CPU power the more the bad guys try to do. Over all the game was a little bit of a disappointment to play, but still not a bad DX10 representation. Our testing run starts right after you get your first mission to clean out the safe-house and ends after the hostage rescue. Settings and performance numbers are shown below.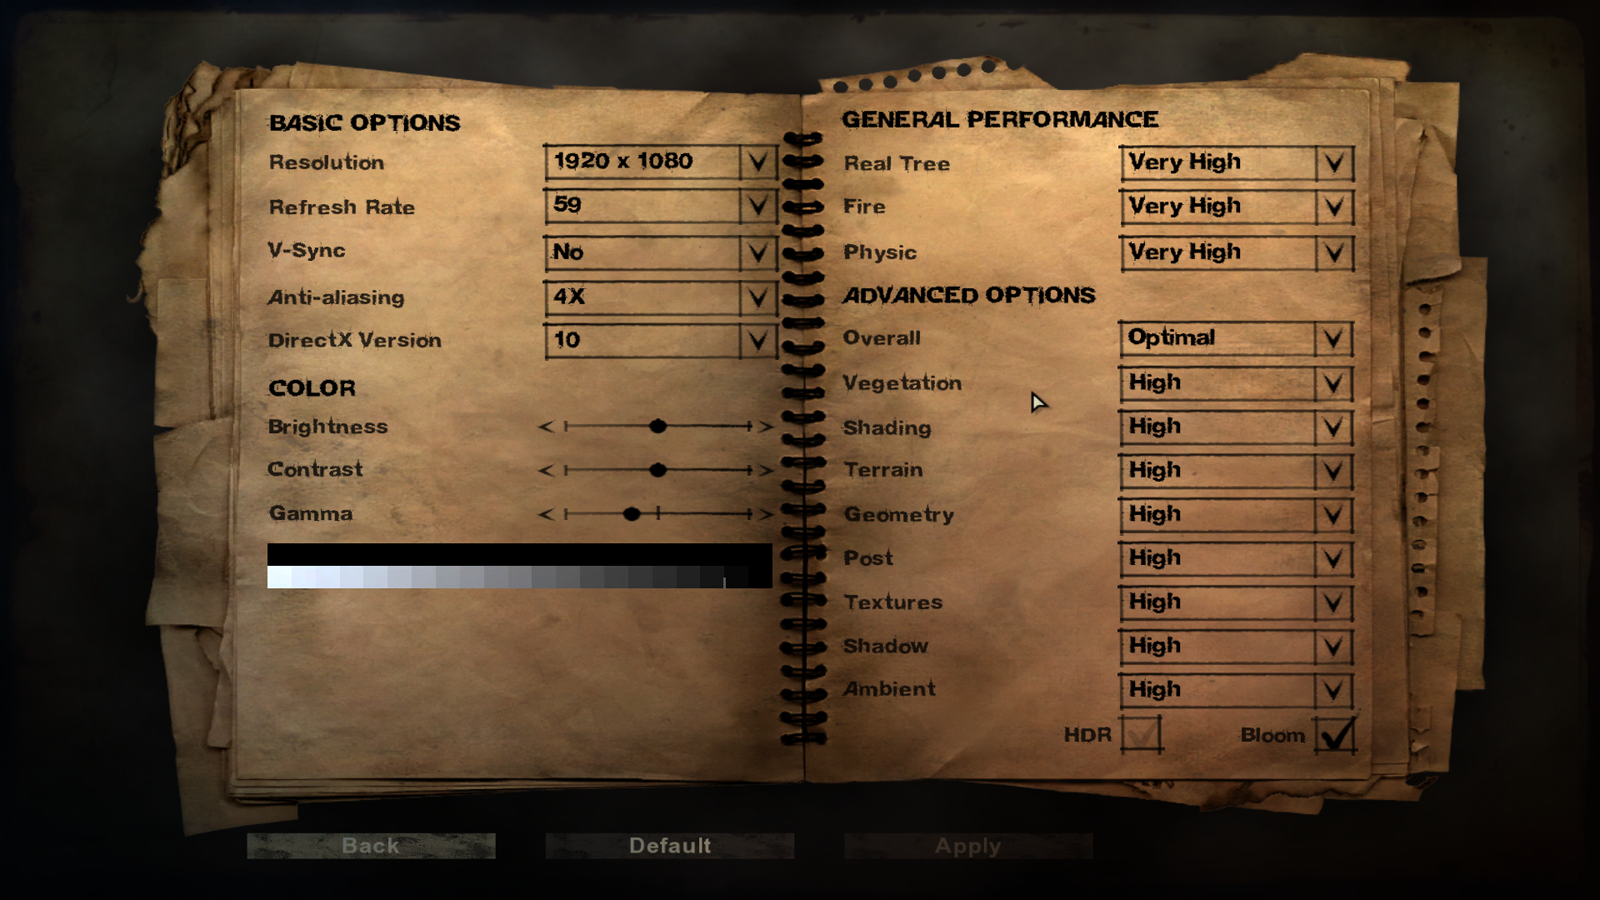
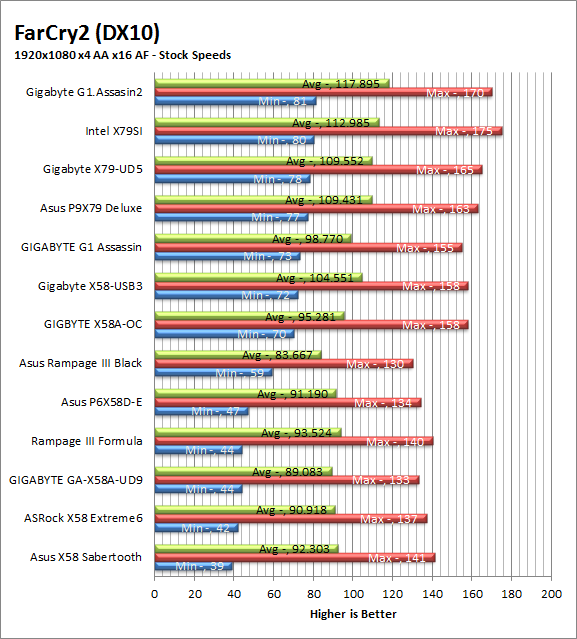
In FarCry 2 the delta is a little larger (7-8FPS) but the UD5 comes in a little higher in the standings. This time we find the UD5 at third place. Still the difference in frame rates is so slight that you would never notice it in real world usage.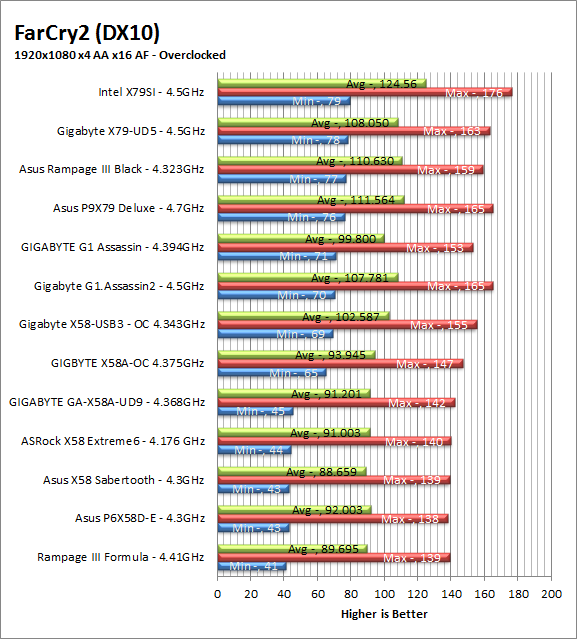
Battlefield Bad Company2 DX11 –
I have liked many of the Battlefield games. They usually tend to be fast paced and fun. With Battlefield Bad Company 2 you do get some of that, but there is something about the graphics and the movement that just does not sit right. The AI is a less sophisticated form of the bar fight AI, but it gets the job done. Still, the game is good for testing as it can put a strain on the components of the board. Out testing run is the entire first level, from beginning to end. Settings are shown below along with the raw numbers.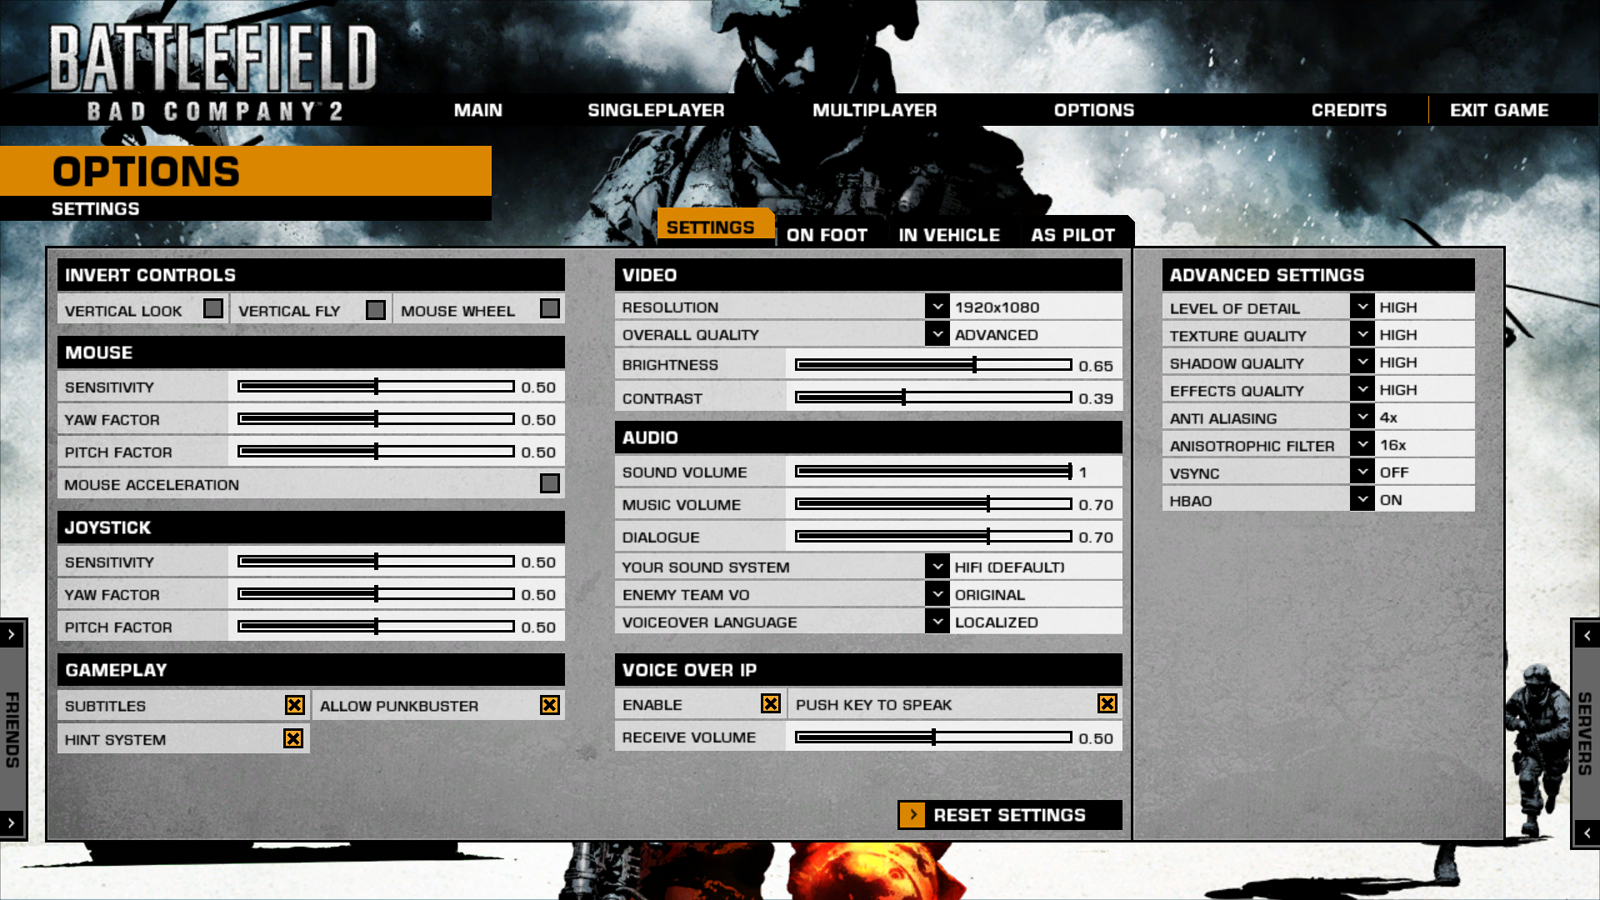
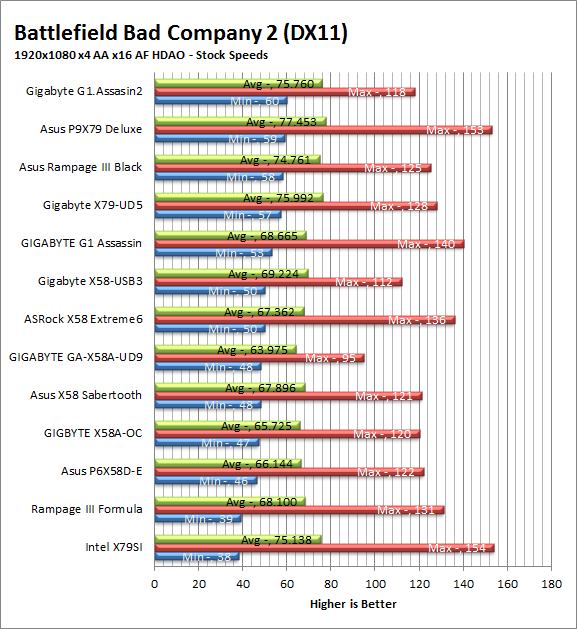
For Bad Company 2 the UD5 did well at stock speeds, it was only 3 FPS behind the overall leader. Again at the speeds we are seeing here you are not likely to see any difference if you put these systems side-by-side. So while we can call a “leader” based on the numbers really almost any of these boards can do the job.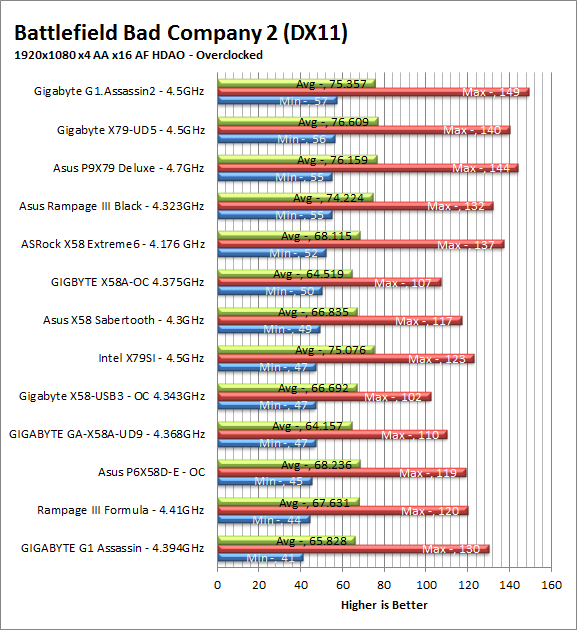
Gaming wrap-up -
The X79-UD5 was not the fastest gaming board we have tested; at least not in terms of raw frame rates. However the gaming experience was better than many boards we have tested at the same price point. This was mostly due to the Dolby Home Theater audio processing going on. As with many games the audio is often overlooked for flashy graphics or high frame rates. The problem is that there are VERY few games that can out match today’s GPUs. This leaves quite a bit open in terms of gaming experience and audio is one of these places. If you are a gamer you will get some nice sounding audio to add to your gaming experience. For us this made the X79-UD5 a very good option for gaming.
Value -
Value is another very subjective topic. What is expensive to some might be a deal to others. You can look at this topic in multiple ways. One is raw price and the other is what you get for the money. Each is accurate and both are correct ways to look at price/value. We tend to look at features, performance and real-property when we discuss value. However, we also take into account the raw cash cost of the item.
The X79-UD5 will put a $325 dollar dent in your wallet which could seem like a lot of money on the surface. However, when you consider the market space that it is in and other boards in the same price range it is not far off of the mark.
Conclusion -
The Gigabyte X79-UD5 is a solid board, it has a fairly nice layout and the design choices show us that Gigabyte is looking to put this at the top of the mid-range lineup. Gigabyte does need to work on the memory performance and to fix the Multiplier overclocking issue that we ran into (on multiple occasions). Still with a $325 price tag for an X79 motherboard that comes complete with the WiFi/Bluetooth module we are satisfied with its performance for the most part. You can check out our final thoughts in our conclusion video below.
Discuss this in our Forum
