Ok first things first, let’s talk a little about numbers. The poll claims that total of 1,332 people responded to a survey. Although it would be interesting to know how many people they called, that number is more for curiosity than anything else. Now let’s take a more realistic look at the number there According to some estimates the US population is sitting around 314 Million people; at 1,332 this poll is around 4% of the population of the US. We can use the total population because part of their survey included people that do not own a smartphone. Still there are unknowns about this study that make it very suspect; we have no demographics on the data; what were the geographic locations used? What was the age range for the poll, how did they get the numbers called? There are many questions that are not answered about the survey which would make the data unusable for anything other than PR right here (and we talked about this type of study before).
The second bit of information that makes the poll useless for anything other than hits and PR is the way they detailed out who will buy the new iPhone. They say that 74% of iPhone 4 owners will, but do not say how many people that represents out of the 1332 people that chose to respond. This number is an important factor in this bit of data because the larger the number the more significant the information. If there were only 20 iPhone 4 owners responded then the 74% listed is a very insignificant number. This can be said for all of the numbers listed here. Simply because they do not say what each listing represents there is no basis for statistical comparison. Even a listing of what percentage each group represented in the total respondents would have made this more valid; however it appears that they chose to leave that out.
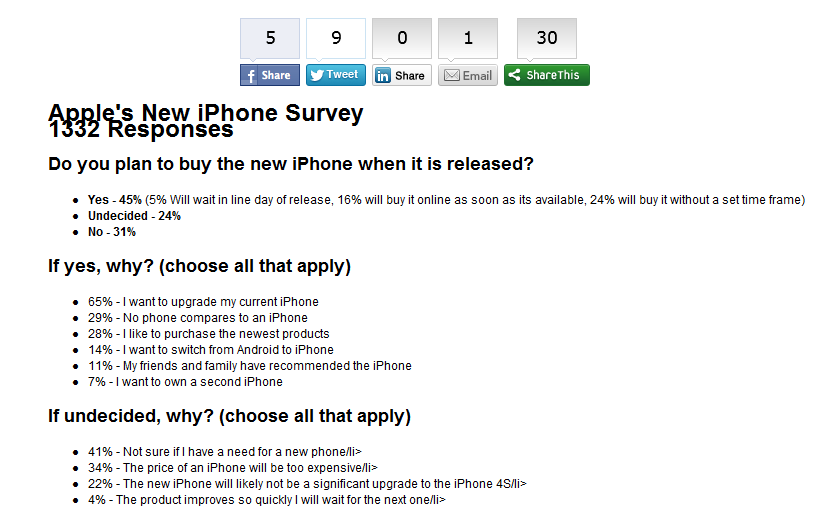
Then you have the headlines that have been generated by this “survey” most have claimed that 22% of Android owners will get the new iPhone. However a much more interesting claim is that 55% will not get the new iPhone when released (which is where we got our attention grabbing headline). This is not 55% of a specific group, but 55% of the whole. 31% said they would not get it at all and 24% are undecided. You can also show that 26% of iPhone 4 Owners, 29% of iPhone 3G Owners, and a whopping 36% of iPhone 4s owners will not be getting the new iPhone. The reason most often cited as a reason not to get it is “I already own a phone and don’t need an upgrade” and 53% of the total respondents. 38% said they want an Android phone (this is 38% of the total people that said no or about 150 people) instead of an iPhone. See how easy it is to use statistics to present the data you want?
In short the survey was presented to show the desire and popularity for Apple products. It fails as anything more than PR and click fodder. It has no true statistical basis because of the many (intentional) omissions. It is sad that so many have grabbed onto this as a factual representation of what the market thinks and are pushing it out to consumers. We will leave you with this, in any poll, survey or statistical analysis, even one that supports your own beliefs, take a look at the data, how it is presented, and ask yourself what is missing in the information shown. You will quickly find that most data available on the internet is misused and do not paint the whole picture. Many are so flawed that they would have given my statistics instructors a stroke.
You can check out the survey at Techbargains.com
Discuss this in our Forum
