
To kick things off we will give you the data tables for the top 5 Vendors for Worldwide PC Shipments and links to both reports.
Gartner;
 IDC;
IDC;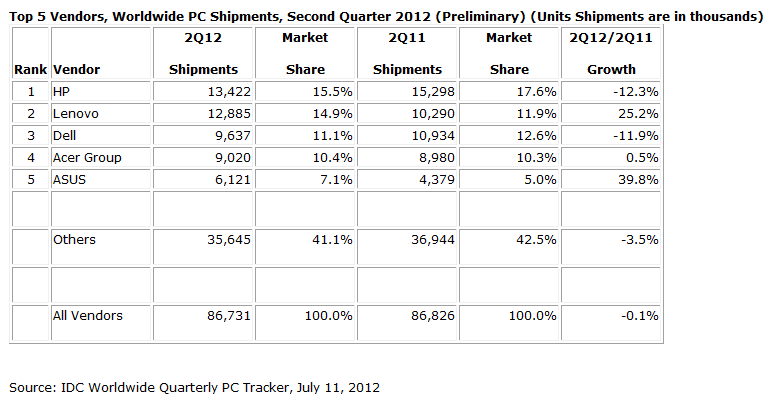 There now that is out of the way let’s get down to the real reasons we are here. Both Gartner and IDC report on number of “shipped” units they do not cover final sales to consumers (if these are unit shipped to a package store that is good as well). So the numbers for all of the manufacturers listed can be misleading and do not truly represent actual sales figures. What is odd that that although both companies claim to get their data from the same sources their numbers are exceptionally different in some cases. For example;
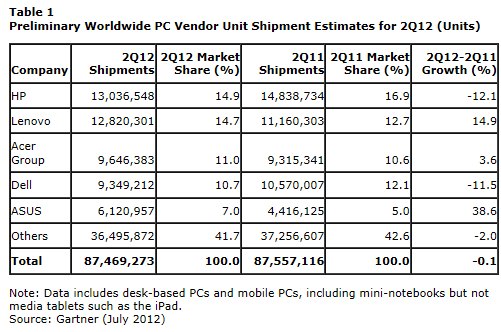
Gartner states that in Q2 2012 HP shipped 13,036,548 PCs. IDC, on the other hand shows a total of 13,422,000 a number that is a about a 2-3% difference. Discrepancies like this pop up all over the place and due to the difference in reported units shipped the overall percentages for growth are statistically different.
This difference gives many media outlets the chance to report what they want instead of the actual fact (which should include both reports due to their differences in reported numbers). They take advantage of the fact that very few people bother to click on the supporting links. Most will assume that the links support the data. Now, this should be the case in all instances, but we have found situations where the linked articles do not contain full support for the argument. Instead many of these have small references to the subject and not full supporting proof.
In the case of these two reports by linking both of them and then only using the data that suits the publication we can manipulate the information in a very real way. As another example let’s take a look at the Acer Group. I could say (and be partially truthful) that the Acer Group only had a .5% growth in shipments over Q2 2011. I would be disingenuous though because I am not reporting that while IDC showed Acer to only have a .5% growth Gartner showed a 3.6% growth; a big difference of 3.1% which would have an impact on investors and consumers.
Another statistically significant difference is the reporting of Lenovo’s numbers. Gartner shows a growth of 14.9% while IDC shows a staggering 25.2% this is a massive delta between the two reports; which once again can be used to present misleading information if used improperly.
Moving to the Top 5 US Vendors we will again show you both sides of the story, the links are the same as those above and we encourage you to check them out.
Gartner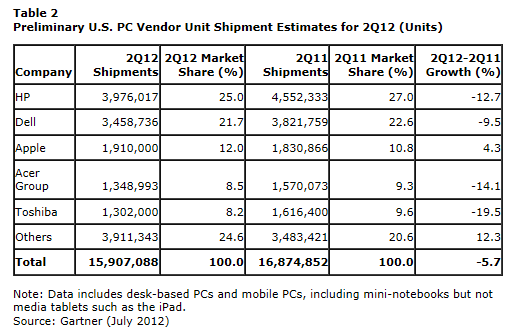
IDC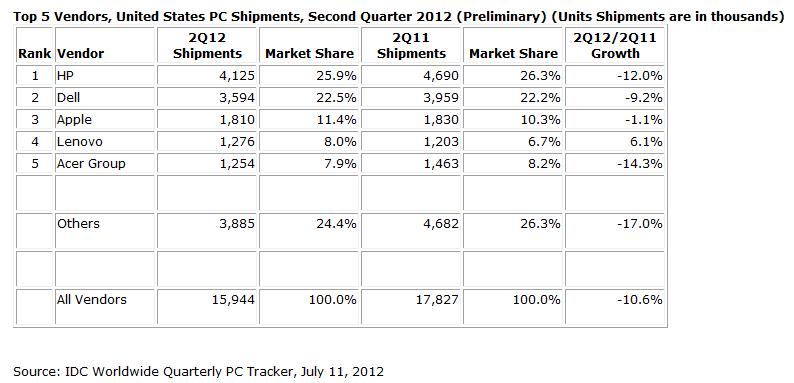 Here the numbers seem to get closer to each other with the exception of two glaring differences. Gartner did not include Lenovo as a separate company, but decided to lump them into “others”. This is unusual as Lenovo is a leading manufacturer in the US and deserves to be broken out in the data which IDC has done showing them with a growth of 6.1% over Q2 2011 (and with an 8% market share).
The second glaring difference is in the number of reported Apple units shipped. IDC shows 1,810,000 but for some reason Gartner has a number that is exactly 100,000 different. This is a very unusual difference to be honest with you and one that we are very curious about. How did Gartner get a number that is that significantly different from IDCs? The difference is very important considering their have almost the exact number for Q2 2011. Using Gartner’s numbers you end up showing Apple up by 4.3% using IDC’s Apple is down 1.1%...
We have tracked a significant number of websites that picked and chose the worst numbers for “windows-based” PCs while pulling the best for Apple. This is a serious lack of professionalism in reporting. Guys, report from one report or both, but do not pick and choose the numbers you like best.
So we can see that shipments of PCs are down for Q2 2012 globally by .1% this is not a significant number and does not represent a “trend” for the death of the PC as many are also reporting. What it does show is a transitory period while the market waits for Windows 8 OSX Mountain Lion and a few other nice new items that influence PC purchases. We can expect to see Q3 drop some despite the back to school feeding frenzy that is sure to take place.
Discuss this in our Forum
